NOAA’s National Centers for Environmental Information (NCEI) has released an innovative mapping tool that provides county-level information on natural disaster hazards across the United States. This new feature provides significant enhancements to the state-level data on NOAA’s Billion-Dollar Disasters website.
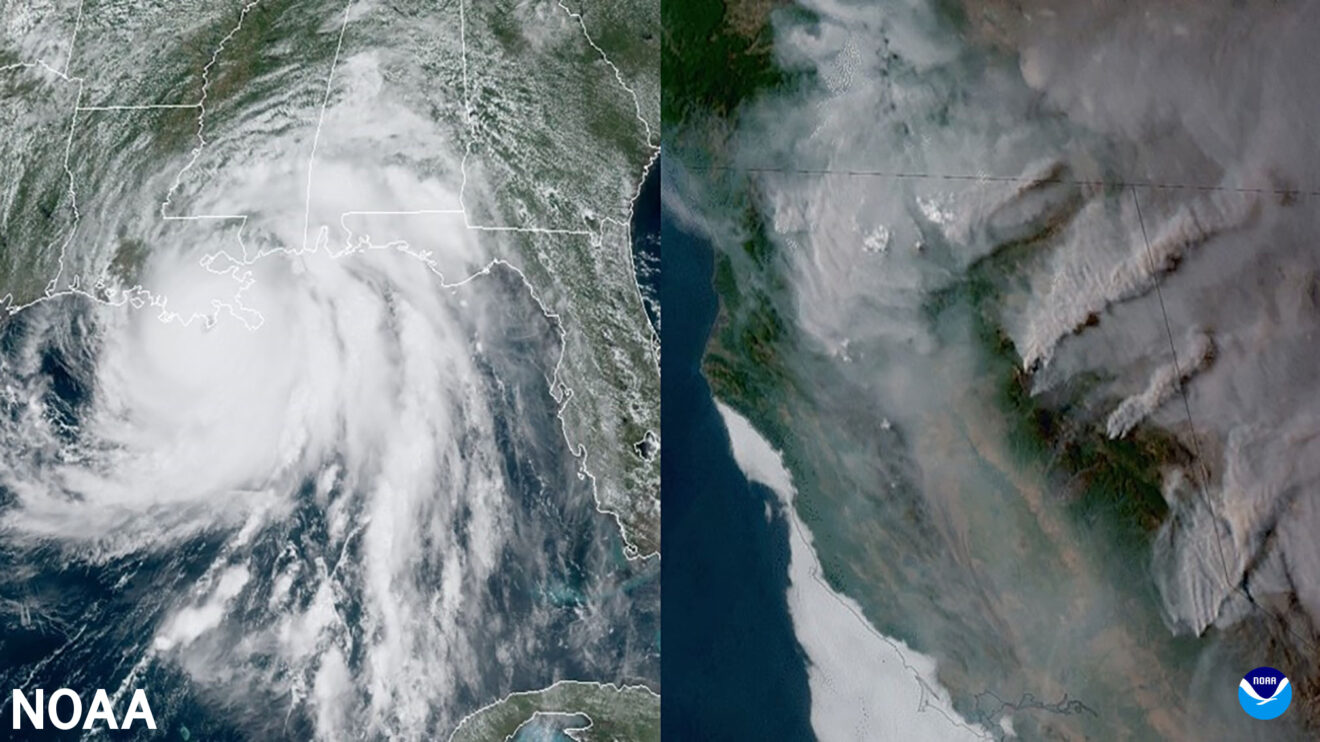
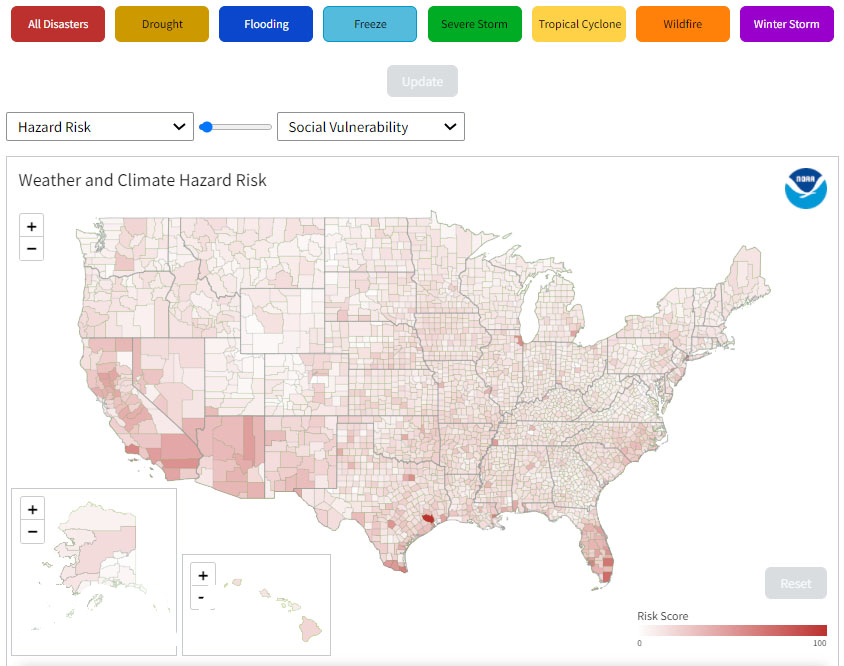
Developed by NCEI with data from NOAA, FEMA and academic institutions, this interactive NOAA mapping tool provides detailed information on a location’s susceptibility to weather and climate hazards that can lead to billion-dollar disasters—such as wildfires, floods, drought and heat waves, tornado outbreaks, and hurricanes. The tool expands upon FEMA’s National Risk Index to provide a view of a location’s risk for, and vulnerability to, single or multiple combinations of weather and climate hazards for every county and county-equivalent in all 50 states, and the District of Columbia.
“Understanding hazard risk and social vulnerability at the county level are increasingly important to mitigating weather and climate hazards,” said Adam Smith, lead for NOAA NCEI’s Billion-Dollar Disaster Program. “A location’s risk depends on several factors, including population, infrastructure and exposure to natural hazards. Vulnerability reflects a county’s ability to prepare for, respond to, and recover from hazards based on socioeconomic factors. This new mapping tool can be a source for homeowners, community planners, emergency managers and other decision makers to help prepare for and mitigate natural disasters in their community.”
This online resource comes at a time when the number and cost of billion-dollar disasters in the U.S. has been increasing. In 2020 alone, the nation experienced an unprecedented 22 separate billion-dollar climate and weather disasters that killed at least 262 people. As of October 8, 2021, the U.S. had been impacted by 18 separate billion-dollar disasters with total, direct losses of $104.8 billion—already more costly than 2020.
“The increasing number and cost of billion-dollar disasters can be linked to a combination of factors, including increased exposure, social vulnerability and climate change,” said Russell Vose, chief of the NOAA NCEI Climatic Analysis and Synthesis Branch. “This new tool will support informed decision-making for saving lives and protecting property across the United States.”
Since 1980, the U.S. has sustained 308 weather and climate disasters where overall damages/costs reached or exceeded $1 billion. The total cost of these 308 events exceeds $2.085 trillion, with $700 billion in damages during the last five years.
NOAA will continue developing tools like this in order to deliver authoritative climate and data services to the public. Watch this demonstration to learn how to navigate this new tool.
Source: NOAA
